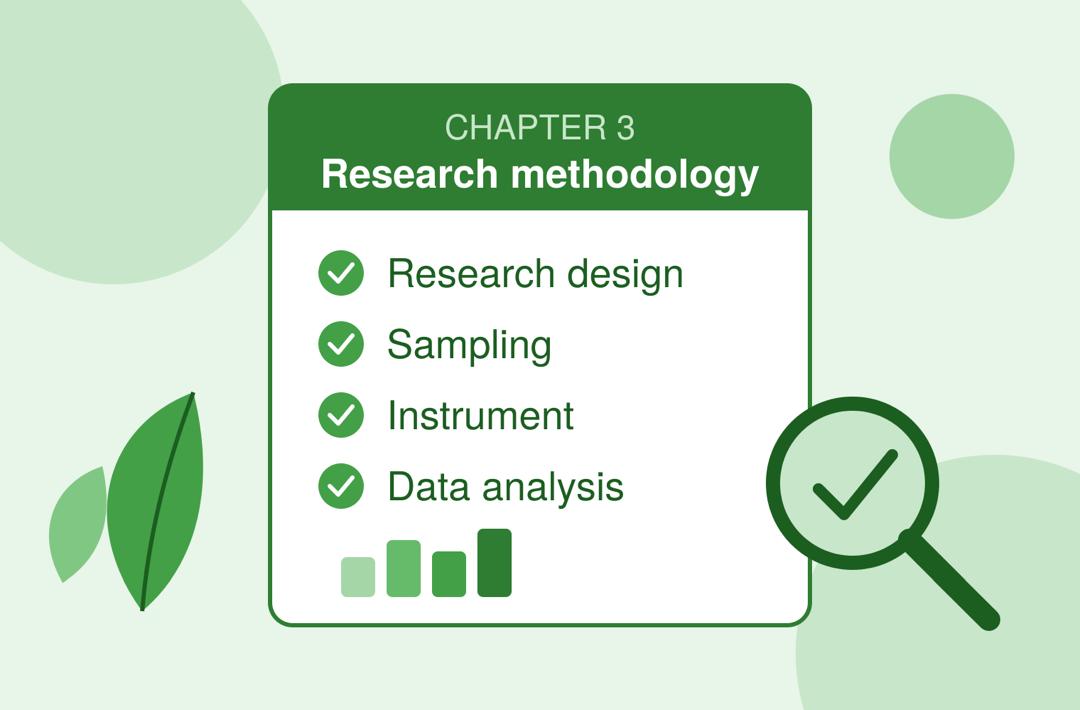
To write chapter 3 of a project, explain how you carried out your study in this order: research design, population, sample size and sampling technique, instrument for data collection, validity and reliability of the instrument, method of data collection, and method of data analysis.
Chapter 3 answers one question: "How did you get your results, and why should anyone trust them?" This guide walks you through each part in plain language, then gives you a complete sample methodology you can adapt for your own topic.
What is Chapter 3 of a project?
Chapter 3 is the research methodology chapter. If Chapter 1 tells your reader what you are studying and Chapter 2 shows what others have said, Chapter 3 shows what you did.
Think of it as a recipe. Someone who reads it should be able to repeat your study step by step and get similar results. That is what makes your work credible to your supervisor, your defense panel and any future researcher.
A good Chapter 3 is:
Specific: it gives numbers, names and places, not vague statements.
Justified: it says why you chose each method, not only what you chose.
Consistent: it matches your research questions and hypotheses from Chapter 1.
The parts of Chapter 3 at a glance
Most Nigerian universities follow a similar structure. Your department may rename or merge some headings, so always confirm with your supervisor's guide.
Section | What it covers |
|---|---|
3.1 Introduction | A short preview of the chapter |
3.2 Research design | The overall approach to the study |
3.3 Area of the study | Where the study took place |
3.4 Population of the study | Everyone you are interested in |
3.5 Sample size and sampling technique | The smaller group you actually studied, and how you picked it |
3.6 Instrument for data collection | The tool you used, e.g. a questionnaire |
3.7 Validity of the instrument | Does it measure what it should? |
3.8 Reliability of the instrument | Does it give consistent results? |
3.9 Method of data collection | How you administered and retrieved the instrument |
3.10 Method of data analysis | The tools used to analyse your data |
3.11 Ethical considerations (if required) | How you protected your respondents |
↔ Swipe to see more
Now let us go through each part.
3.1 Introduction
Open the chapter with two or three sentences that tell the reader what is coming. Mention that the chapter describes the research design, population, sampling, instrument, validity, reliability, data collection and data analysis.
Example: "This chapter presents the methods and procedures used in carrying out the study. It covers the research design, population of the study, sample size and sampling technique, instrument for data collection, validity and reliability of the instrument, method of data collection and method of data analysis."
3.2 Research design
The research design is your overall plan. You are saying, "This is the type of study I carried out." Common choices include:
Descriptive survey design: you collect opinions or facts from a group using questionnaires or interviews. This is the most common design in Nigerian undergraduate projects.
Experimental design: you test the effect of a treatment, for example teaching one class with a new method and another with the old method.
Case study design: you study one organisation, school or community in depth.
Correlational design: you test the relationship between two or more variables.
Always add a reason for your choice. A single sentence such as "The descriptive survey design was adopted because it allows the researcher to collect data from a large group and describe their views as they exist" is enough to show you understand your own decision.
3.3 Area of the study
Name the location and give a short description. This could be a university, a local government area, a hospital or a company. Two to four sentences are enough.
3.4 Population of the study
The population is the entire group your study is about. It must be clearly defined and, where possible, supported with a number and a source.
Example: "The population comprised 2,400 final-year undergraduate students of the Faculty of Social Sciences, as obtained from the Faculty Examinations Office."
Tip: If you cannot get an exact figure, ask the registry or the department's administrative office and cite them as your source.
3.5 Sample size and sampling technique
You usually cannot study everybody, so you pick a sample, a smaller group that represents the population.
Sample size. The most popular formula in Nigerian projects is the Taro Yamane formula:
n = N / (1 + N(e)²)
Where n is the sample size, N is the population, and e is the margin of error (usually 0.05).
Worked example using a population of 2,400:
n = 2,400 / (1 + 2,400 × 0.05²)
n = 2,400 / (1 + 2,400 × 0.0025)
n = 2,400 / (1 + 6)
n = 2,400 / 7 = 342.86, rounded up to 343
Sampling technique. Say how you picked the 343 people. Common methods:
Simple random sampling: everyone has an equal chance of being selected.
Stratified random sampling: you divide the population into groups (for example by department or level) and pick from each group in proportion to its size.
Purposive sampling: you deliberately choose people who have the information you need.
Convenience sampling: you use people who are easy to reach. It is easy, but it is the weakest option, so use it only when you must and say so honestly.
3.6 Instrument for data collection
The instrument is the tool you used to gather data. For most surveys this is a structured questionnaire. Describe it clearly:
What is its title?
How many sections does it have?
What kind of questions does it contain?
What response scale did you use?
A Likert scale is the most common. For example: Strongly Agree (SA) = 4, Agree (A) = 3, Disagree (D) = 2, Strongly Disagree (SD) = 1.
Other instruments include interview guides, observation checklists and tests.
3.7 Validity of the instrument
Validity asks: "Does this instrument really measure what it is supposed to measure?"
The usual approach for undergraduates is face and content validity. You give a draft of your questionnaire to your supervisor and one or two experts in your field. They check whether the items are clear, relevant and cover your research questions. You then correct the items based on their comments.
Example: "The instrument was subjected to face and content validation by the project supervisor and one lecturer in the Department of Measurement and Evaluation. Their corrections and suggestions were used to produce the final version."
3.8 Reliability of the instrument
Reliability asks: "Will this instrument give consistent results if used again?"
A common method is a pilot test. You give the questionnaire to a small group (about 20 to 30 people) outside your actual sample, then calculate a reliability coefficient. For Likert-type questionnaires, the usual choice is Cronbach's alpha. A value of 0.70 or above is generally accepted as reliable.
Other methods include test-retest and split-half. Whichever you use, report the final figure.
3.9 Method of data collection
Describe the practical steps: who administered the questionnaire, how it was distributed (hand-delivered, online form, WhatsApp link), how long respondents had to complete it, and how many copies were returned and usable.
Example: "The researcher, with the help of two research assistants, administered 343 copies of the questionnaire in person. Respondents completed the forms on the spot, and 331 copies were properly filled and returned, giving a return rate of 96.5%."
3.10 Method of data analysis
Explain how you will turn raw responses into answers.
Descriptive statistics such as frequency counts, simple percentages and mean scores answer your research questions.
Inferential statistics such as the t-test, chi-square, ANOVA, correlation or regression test your hypotheses.
State the decision rule clearly. For a 4-point Likert scale, the benchmark mean is (4 + 3 + 2 + 1) ÷ 4 = 2.50. Any item with a mean of 2.50 or above is "Agree", and below 2.50 is "Disagree". For hypotheses, say the level of significance, usually 0.05, and whether you reject or fail to reject the null hypothesis.
Mention your tool as well, such as SPSS, Microsoft Excel or Stata.
3.11 Ethical considerations
Many departments now ask for a short note on ethics. State that participation was voluntary, responses were kept confidential, names were not collected, and the data were used only for academic purposes.
A full sample Chapter 3 you can adapt
Sample topic: Influence of Social Media Use on the Academic Performance of Undergraduate Students in a Nigerian University.
(All figures below are hypothetical and are for illustration only. Replace them with your own details.)
CHAPTER THREE
RESEARCH METHODOLOGY
3.1 Introduction
This chapter presents the methods and procedures used in carrying out the study. It covers the research design, area of the study, population, sample size and sampling technique, instrument for data collection, validity and reliability of the instrument, method of data collection and method of data analysis.
3.2 Research Design
The study adopted the descriptive survey design. This design was considered appropriate because it enables the researcher to collect data from a large group of students and describe their views on social media use and academic performance as they exist, without manipulating any variable.
3.3 Area of the Study
The study was carried out in the Faculty of Social Sciences of the University of Nigeria, Nsukka, Enugu State. The faculty comprises several departments, and its students use social media platforms regularly for communication and learning.
3.4 Population of the Study
The population of the study comprised 2,400 final-year undergraduate students of the Faculty of Social Sciences, as obtained from the Faculty Examinations Office for the 2025/2026 academic session.
3.5 Sample Size and Sampling Technique
The sample size was determined using the Taro Yamane formula at a 5% margin of error:
n = N / (1 + N(e)²)
n = 2,400 / (1 + 2,400 × 0.05²) = 2,400 / 7 = 342.86, approximately 343.
The stratified random sampling technique was used. Students were grouped by department, and respondents were selected from each department in proportion to the number of students in it. This ensured that every department was fairly represented.
3.6 Instrument for Data Collection
The instrument was a structured questionnaire titled "Social Media Use and Academic Performance Questionnaire (SMUAPQ)". It had two sections. Section A collected the respondents' demographic information (gender, department, age). Section B contained 15 items based on the research questions, measured on a 4-point Likert scale: Strongly Agree (4), Agree (3), Disagree (2) and Strongly Disagree (1).
3.7 Validity of the Instrument
The questionnaire was subjected to face and content validation by the project supervisor and one lecturer in the Department of Measurement and Evaluation. They checked the clarity and relevance of the items, and their corrections were used to produce the final version.
3.8 Reliability of the Instrument
A pilot test was conducted using 30 students of a nearby department who were not part of the main sample. The responses were analysed using Cronbach's alpha, which gave a reliability coefficient of 0.78. This shows that the instrument was reliable for the study.
3.9 Method of Data Collection
The researcher, with the help of two research assistants, administered the 343 copies of the questionnaire personally to the respondents in their lecture halls and hostels. Respondents completed the forms on the spot to improve the return rate. In all, 331 copies were properly filled and returned, representing a return rate of 96.5%.
3.10 Method of Data Analysis
Data were analysed using the Statistical Package for the Social Sciences (SPSS), version 25. Frequency counts, simple percentages and mean scores were used to answer the research questions. A mean of 2.50 and above was accepted as "Agree", while a mean below 2.50 was regarded as "Disagree". The hypothesis was tested using simple linear regression at the 0.05 level of significance. The null hypothesis was rejected where the p-value was less than 0.05 and retained where it was greater than or equal to 0.05.
3.11 Ethical Considerations
Participation was voluntary. Respondents were assured that their answers would remain confidential and be used strictly for academic purposes. No names were collected.
What if my project is qualitative?
The structure stays almost the same, but a few parts change:
Design: case study, phenomenological or ethnographic design.
Sampling: purposive or snowball sampling, with smaller samples (often 8 to 20 participants).
Instrument: an interview guide or focus group guide.
Validity and reliability: replaced by trustworthiness, which covers credibility, transferability, dependability and confirmability.
Analysis: thematic analysis instead of statistical tests.
7 common Chapter 3 mistakes to avoid
Copying a sample without adapting it. Supervisors can tell. Change the population, numbers and tools to match your own study.
Mismatch with Chapter 1. If you have three research questions and two hypotheses, your instrument and analysis must address all of them.
Choosing a formula and not showing your working. Always show the calculation for your sample size.
Forgetting to justify your choices. Add a "because" to every decision.
Using the wrong tense. In a proposal, use the future tense ("will be used"). In the final project, use the past tense ("was used").
Skipping reliability. Validity alone is not enough. Report your coefficient.
Leaving the questionnaire out. Put a copy in the appendix.
Quick checklist before you submit
My research design matches my research questions
My population has a number and a source
I showed how I calculated the sample size
I named my sampling technique and why I chose it
My instrument is described fully
I reported validity and a reliability coefficient
My data collection steps are clear
My analysis tools and decision rule are stated
My questionnaire is in the appendix
Frequently asked questions
What are the parts of Chapter 3 of a project? The main parts are the introduction, research design, area of the study, population, sample size and sampling technique, instrument for data collection, validity, reliability, method of data collection and method of data analysis. Some departments add ethical considerations.
How long should Chapter 3 be? Most undergraduate projects have a Chapter 3 of about 3 to 8 pages. Follow your department's guide, since length varies.
What is the difference between research design and research methodology? The research design is the overall plan of the study, such as a survey or an experiment. The research methodology is the whole chapter, covering the design and all the procedures used to carry it out.
How do I calculate my sample size in a project? For a known population, use the Taro Yamane formula: n = N / (1 + N(e)²), with e usually set at 0.05. You can also use the Krejcie and Morgan table if your supervisor prefers it.
Which statistical tool should I use for analysis? Use mean and percentages for research questions. For hypotheses, choose a test that fits your data: t-test for comparing two groups, ANOVA for three or more, chi-square for categories, and correlation or regression for relationships.
Can I write Chapter 3 before collecting my data? Yes. In fact you must, since your supervisor will approve your methodology before you go to the field. Just use the future tense until the data are collected.
Final thoughts
Chapter 3 can feel technical, but it is really a clear, honest account of how you did your research. Follow the order in this guide, justify each choice with a short reason, and keep everything consistent with Chapters 1 and 2. If you do that, you will have a strong chapter and an easier time at your defense.
Ready to write yours?
Draft your methodology in ProjectWriter. Enter your topic, research questions and design, and get a structured Chapter 3 you can edit and make your own.
Reviews
No reviews yet — be the first.