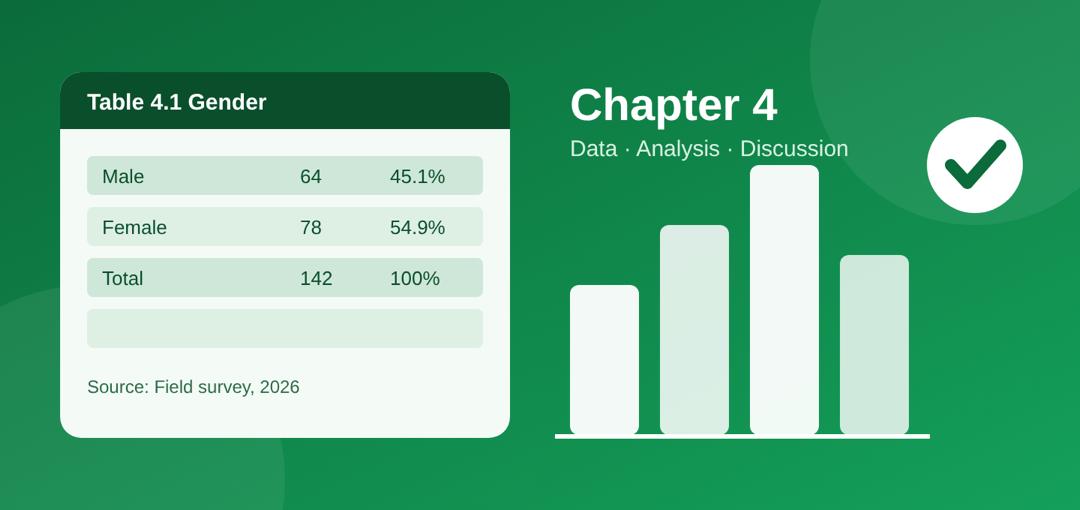
Chapter 4 of a project is where you present the data you collected, analyse it to answer your research questions, test your hypotheses and explain what the results mean. Write it in this order: response rate, respondents’ profile, analysis of each research question, hypothesis testing, then discussion of findings. Show each result in a table, then interpret it in plain words.
Most students get stuck here, and it is easy to see why. Chapters 1 to 3 are mostly theory and plans. Chapter 4 is where your own data finally speaks, and many students dump tables on the page without saying what they mean. This guide shows you how to avoid that, with a complete worked example you can copy the pattern of.
What Chapter 4 Is Really For
Chapter 4 answers one question: what did we find? Every research question and hypothesis from Chapter 1 must get an answer here. If it was asked in Chapter 1, it must be answered in Chapter 4. Nothing new should appear that you did not promise earlier.
Chapter 4 is also not the place for opinions or advice. Your recommendations belong in Chapter 5. Here you only report, analyse and explain.
The Standard Structure of Chapter 4
Most Nigerian universities follow a layout like this. Always confirm with your department’s project handbook, because some add or rename sections.
4.1 Introduction: two or three sentences saying what the chapter covers and which tool you used (SPSS, Excel, etc.).
4.2 Data presentation: response rate and demographic profile of respondents.
4.3 Data analysis: one sub-section per research question.
4.4 Test of hypotheses: the statistical test, the result and your decision.
4.5 Discussion of findings: what the results mean, compared with your Chapter 2 literature.
Tip: Copy your research questions and hypotheses from Chapter 1 into a checklist before you start. Tick each one as you answer it.
Step 1: Report Your Response Rate
Begin by telling the reader how many questionnaires you shared and how many came back usable. This shows your data is reliable.
Table 4.1: Questionnaire distribution and retrieval
Details | Frequency | Percentage |
Questionnaires distributed | 150 | 100% |
Questionnaires retrieved and valid | 142 | 94.7% |
Not returned or invalid | 8 | 5.3% |
↔ Swipe to see more
How to write it: “A total of 150 questionnaires were distributed to students of the University of Ibadan. Out of these, 142 (94.7%) were returned and found valid, while 8 (5.3%) were either not returned or wrongly filled. The analysis is therefore based on 142 responses.”
Step 2: Present the Respondents’ Profile
Next, describe who answered: gender, age, level, department and so on. Use only the details that matter to your study.
Table 4.2: Age distribution of respondents
Age group | Frequency | Percentage |
16 to 20 years | 38 | 26.8% |
21 to 25 years | 79 | 55.6% |
26 years and above | 25 | 17.6% |
Total | 142 | 100% |
↔ Swipe to see more
How to write it: “Table 4.2 shows that most respondents (55.6%) were between 21 and 25 years old, followed by those aged 16 to 20 (26.8%). Only 17.6% were 26 years and above. This suggests the sample was largely made up of young adults.”
Step 3: Analyse Each Research Question
Take your research questions one at a time. Restate the question, show the table, then interpret it. Never leave a table standing alone.
Research Question 1: To what extent do students use WhatsApp for academic purposes?
Table 4.3: Mean responses on academic use of WhatsApp (4-point scale)
Item | Mean | Decision |
I use WhatsApp groups to share lecture notes | 3.21 | Agree |
I use WhatsApp to discuss assignments | 3.05 | Agree |
I use WhatsApp to ask lecturers questions | 2.12 | Disagree |
Grand mean | 2.79 | Agree |
↔ Swipe to see more
Decision rule: mean of 2.50 and above = Agree; below 2.50 = Disagree.
How to write it: “Table 4.3 shows that students agreed they share lecture notes (mean = 3.21) and discuss assignments (mean = 3.05) on WhatsApp. However, they disagreed that they use it to ask lecturers questions (mean = 2.12). With a grand mean of 2.79, which is above the 2.50 benchmark, it can be concluded that students use WhatsApp to a high extent for academic purposes, mostly among themselves rather than with lecturers.”
The interpretation formula: (1) point to the table, (2) state the highest and lowest result with numbers, (3) say what the overall result means for the research question.
Step 4: Test Your Hypotheses
If your study has hypotheses, test them with the statistical tool named in Chapter 3. Common choices are Pearson correlation, chi-square, t-test and simple regression. State the null hypothesis, show the result, then give your decision.
H0: There is no significant relationship between WhatsApp use and students’ academic performance.
Table 4.4: Pearson correlation result
Variables | N | r | p-value | Decision |
WhatsApp use and academic performance | 142 | 0.41 | 0.000 | Reject H0 |
↔ Swipe to see more
How to write it: “Table 4.4 shows a positive and moderate correlation (r = 0.41) between WhatsApp use and academic performance. Since the p-value (0.000) is less than 0.05, the null hypothesis is rejected. There is a significant relationship between WhatsApp use and students’ academic performance.”
The rule: if p is less than 0.05, reject the null hypothesis. If p is 0.05 or more, fail to reject it.
Step 5: Write the Discussion of Findings
This is the part that earns the highest marks. Do not repeat your tables. Explain what the results mean and connect them to the studies you reviewed in Chapter 2.
State the finding: “The study found that students use WhatsApp mainly to share notes and discuss assignments.”
Compare with literature: “This agrees with Adeyemi (2021), who reported similar peer-learning patterns among Nigerian undergraduates.” If your result differs, say so: “This contrasts with…”
Give a reason: “A possible explanation is that students find it easier to ask classmates than lecturers.”
Use real sources from your own Chapter 2 here. The names above are only an example of the pattern.
Common Chapter 4 Mistakes to Avoid
Tables with no explanation. Every table needs a written interpretation.
Mixing results and opinions. Keep advice for Chapter 5.
Percentages that do not add up to 100. Check your totals before submitting.
Missing a research question. Cross-check against Chapter 1.
Wrong table labels. Number tables in order (4.1, 4.2, 4.3) and give each a clear title.
Changing your method. Use the same analysis tools and decision rules you stated in Chapter 3.
Copying results from another project. Supervisors notice, and plagiarism checkers do too.
Chapter 4 Checklist
☐ Response rate stated with a table
☐ Respondents’ profile presented and interpreted
☐ Every research question analysed and interpreted
☐ Every hypothesis tested with a clear decision
☐ Findings discussed and compared with Chapter 2
☐ Tables numbered, titled and sourced (“Field survey, 2026”)
☐ No recommendations or new material slipped in
Where project writer comes in:
Chapter 4 is where most students lose time, not because the maths is hard, but because turning numbers into clear sentences is hard. This is where ProjectWriter fits in. It helps you with the writing, while your data and your findings stay yours.
• Turn tables into sentences. Paste a table and your research question, and get a draft interpretation that follows the formula above: point to the table, state the highest and lowest results, then say what it means.
• Keep to the structure. Work through the 4.1 to 4.5 layout section by section, so no research question or hypothesis gets left out.
• Draft your discussion of findings. Add the studies from your Chapter 2, and ProjectWriter helps you write the comparison: where your results agree, where they differ and a possible reason why.
• Polish your wording. Tidy up table titles, fix unclear sentences and keep a consistent academic tone from 4.1 to 4.5.
Frequently Asked Questions
How long should Chapter 4 be?
Most undergraduate Chapter 4s run between 10 and 25 pages. Length depends on how many research questions you have, so quality matters more than page count.
What is the difference between data presentation and data analysis?
Presentation shows the raw results in tables and charts. Analysis interprets those results and uses them to answer your research questions and test your hypotheses.
Can I use charts in Chapter 4?
Yes. Bar charts and pie charts work well for demographic data. Still add a sentence or two explaining what each chart shows.
Which software should I use for analysis?
SPSS is the most common in Nigerian universities, but Microsoft Excel works for simple percentages, means and charts. Use whatever your Chapter 3 says.
What if my hypothesis is not supported?
That is a valid finding. Report it honestly, then discuss possible reasons in your discussion. Never change data to get a “better” result.
Is the discussion of findings part of Chapter 4 or Chapter 5?
It depends on your department. Many place it in Chapter 4, others in Chapter 5. Check your project handbook or ask your supervisor.
Stuck on your Chapter 4? Draft your Chapter 4 in ProjectWriter.
Reviews
No reviews yet — be the first.